Compare AIFind AIAI NewsAI How-To
About Us
PrivacyTermsFAQContactContact
AIB Inc.Company info
© 2026 AIB Inc.

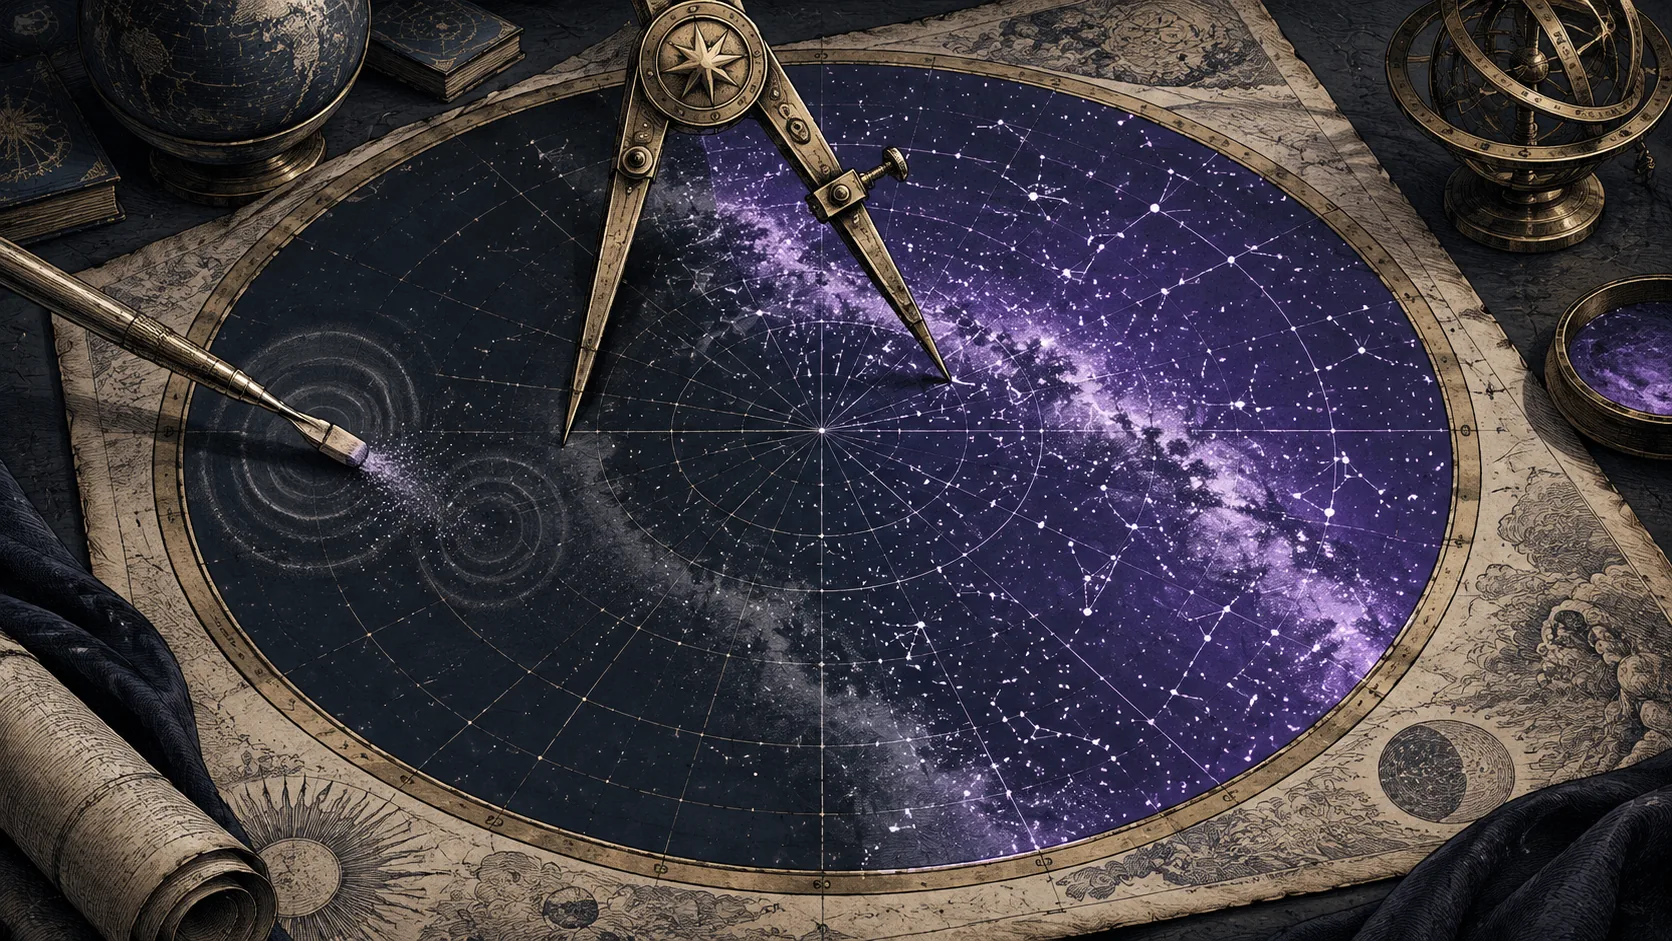
Claude Science Helps Map the Sky in UV
Claude Science Helps Map the Sky in UV

Anthropic Research·Friday, October 9, 2026
  • •Brice Ménard and Claude Science produced a complete ultraviolet map, combining far-UV 154 nm and near-UV 232 nm.
  • •AI agents filled roughly one-third of the sky missing UV observations; tests put estimates within about 10% of measurements.
  • •Claude corrected atmospheric glow in all 38,000 GALEX observations after faint circular artifacts appeared in the map.
  • •Brice Ménard and Claude Science produced a complete ultraviolet map, combining far-UV 154 nm and near-UV 232 nm.
  • •AI agents filled roughly one-third of the sky missing UV observations; tests put estimates within about 10% of measurements.
  • •Claude corrected atmospheric glow in all 38,000 GALEX observations after faint circular artifacts appeared in the map.
  • •Brice Ménard and Claude Science produced a complete ultraviolet map, combining far-UV 154 nm and near-UV 232 nm.
  • •AI agents filled roughly one-third of the sky missing UV observations; tests put estimates within about 10% of measurements.
  • •Claude corrected atmospheric glow in all 38,000 GALEX observations after faint circular artifacts appeared in the map.
  • •Brice Ménard and Claude Science produced a complete ultraviolet map, combining far-UV 154 nm and near-UV 232 nm.
  • •AI agents filled roughly one-third of the sky missing UV observations; tests put estimates within about 10% of measurements.
  • •Claude corrected atmospheric glow in all 38,000 GALEX observations after faint circular artifacts appeared in the map.

Brice Ménard, an astrophysicist at Johns Hopkins University and Anthropic researcher, worked with Claude Science this summer to create what he describes as the first complete map of the sky in ultraviolet light. The map combines far-UV light at 154 nm and near-UV light at 232 nm. About a third of it, including much of the Milky Way’s galactic plane, was predicted because no UV observations existed there; other layers mark each pixel as measured or predicted and give uncertainty estimates. Ménard says the map can help students see the Milky Way’s structure at this wavelength.

Space telescopes are needed to observe ultraviolet light because Earth’s ozone layer absorbs it. Over 50 years, telescopes mapped parts of the sky, but the largest dataset, from NASA’s GALEX mission, covered about two-thirds of the sky in some 38,000 observations from 2003 to 2013. GALEX skipped areas around very bright stars, including much of the Milky Way’s plane, to protect its detectors. Data from NASA’s Swift and South Korea’s FIMS/SPEAR missions filled some gaps, but left others. Ménard says completing the map manually would require weeks of pixel-level calibration and repeated analysis.

Claude Science coordinated AI agents to find public UV surveys, download their data, correct inconsistencies between observations, remove glare around bright stars, and combine surveys from different instruments. The agents cross-calibrated the data, brought images to the same resolution, and aligned them to a common coordinate system. To fill unobserved areas, Claude used inpainting (reconstructing missing image areas from surrounding patterns) and learned how UV brightness relates to visible, infrared, and radio observations across the two-thirds of the sky already mapped in UV. It used those relationships to estimate UV brightness and uncertainty for the remaining third.

Ménard tested the estimates by hiding known UV data and asking the model to reconstruct it. After several rounds of refinement, predictions were within about 10% of actual UV measurements. Claude then added estimates for more than 100 million stars, inferred from visible-light measurements by the European Space Agency’s Gaia satellite. The initial full map was complete, but Ménard later spotted faint circles left by the 38,000 GALEX observations, caused by uneven ultraviolet glow from Earth’s atmosphere. Agents traced the artifact to that leftover glow, and Claude corrected all 38,000 observations; after a couple of hours of processing, the circles disappeared.

Ménard and Claude produced more than a dozen versions over several days. Claude handled hours of computation between planning exchanges with Ménard. The finished map shows UV structures including dust clouds around young stars, rings and loops from explosions of massive stars, faint dust filaments away from the galactic plane, and the Large and Small Magellanic Clouds. Ménard says it can serve as an educational resource alongside other canonical maps, and that he completed the project without giving up time for research. Data came from GALEX and Swift (NASA), FIMS/SPEAR (Korea), TD-1 (Europe), and Planck and Gaia (ESA); Ménard says his role was to guide the agents.

Brice Ménard, an astrophysicist at Johns Hopkins University and Anthropic researcher, worked with Claude Science this summer to create what he describes as the first complete map of the sky in ultraviolet light. The map combines far-UV light at 154 nm and near-UV light at 232 nm. About a third of it, including much of the Milky Way’s galactic plane, was predicted because no UV observations existed there; other layers mark each pixel as measured or predicted and give uncertainty estimates. Ménard says the map can help students see the Milky Way’s structure at this wavelength.

Space telescopes are needed to observe ultraviolet light because Earth’s ozone layer absorbs it. Over 50 years, telescopes mapped parts of the sky, but the largest dataset, from NASA’s GALEX mission, covered about two-thirds of the sky in some 38,000 observations from 2003 to 2013. GALEX skipped areas around very bright stars, including much of the Milky Way’s plane, to protect its detectors. Data from NASA’s Swift and South Korea’s FIMS/SPEAR missions filled some gaps, but left others. Ménard says completing the map manually would require weeks of pixel-level calibration and repeated analysis.

Claude Science coordinated AI agents to find public UV surveys, download their data, correct inconsistencies between observations, remove glare around bright stars, and combine surveys from different instruments. The agents cross-calibrated the data, brought images to the same resolution, and aligned them to a common coordinate system. To fill unobserved areas, Claude used inpainting (reconstructing missing image areas from surrounding patterns) and learned how UV brightness relates to visible, infrared, and radio observations across the two-thirds of the sky already mapped in UV. It used those relationships to estimate UV brightness and uncertainty for the remaining third.

Ménard tested the estimates by hiding known UV data and asking the model to reconstruct it. After several rounds of refinement, predictions were within about 10% of actual UV measurements. Claude then added estimates for more than 100 million stars, inferred from visible-light measurements by the European Space Agency’s Gaia satellite. The initial full map was complete, but Ménard later spotted faint circles left by the 38,000 GALEX observations, caused by uneven ultraviolet glow from Earth’s atmosphere. Agents traced the artifact to that leftover glow, and Claude corrected all 38,000 observations; after a couple of hours of processing, the circles disappeared.

Ménard and Claude produced more than a dozen versions over several days. Claude handled hours of computation between planning exchanges with Ménard. The finished map shows UV structures including dust clouds around young stars, rings and loops from explosions of massive stars, faint dust filaments away from the galactic plane, and the Large and Small Magellanic Clouds. Ménard says it can serve as an educational resource alongside other canonical maps, and that he completed the project without giving up time for research. Data came from GALEX and Swift (NASA), FIMS/SPEAR (Korea), TD-1 (Europe), and Planck and Gaia (ESA); Ménard says his role was to guide the agents.

Read original (English)·Oct 8, 2026
Infra#claude science#ultraviolet map#inpainting#galex#gaia#astronomy#ai agents#cross calibration